Exploring and discovering unfamiliar codebases is always a challenge. In this blog post, I will introduce a novel way to explore a new codebase by looking at the code coverage using NCrunch.NET.
Background
As a developer, you’re often challenged to understand new libraries; you ask: ‘how does it work’, ‘what makes it tick?’, what parts are involved in this operation?’
I’ve found that usually just reading the documentation or doing tutorials isn’t enough to really grasp how a given code or library works. The goal is actually to get a good mental model for how a codebase works.
This is especially true when I create training material and teaching concepts for my training classes at tn-data.se
Example: The library to understand
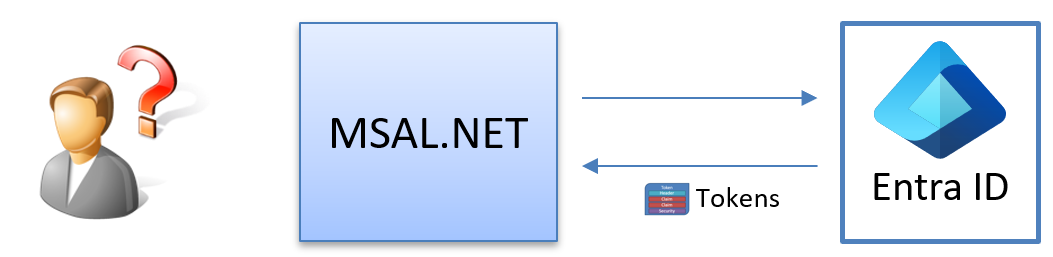
In my case, I wanted to understand how the Microsoft Authentication Library works under the hood. We can use this library to acquire access tokens from Azure Entra ID using OpenID-Connect.
The most obvious option is to step through the code using the debugger, which always works. But what are the alternatives? Can they be faster and more insightful?
The first step I usually take is to download the library’s source code and create my own “class library” based on it. This allows me to step through the code, explore it, and introduce debug statements more easily. In my case, I did this by downloading the code from https://github.com/AzureAD/microsoft-authentication-library-for-dotnet
I find having the source code locally is really helpful because I can easily step through the code and add debug statements or minor modifications to improve my understanding of the codebase. I used this technique when I wrote the DefaultAzureCredentials Under the Hood blog post.
Exploring the code base
After creating the class library locally, the next step is analyzing its structure. Where should I start?
An obvious starting point for exploring an existing code base is to use NDepend . NDepend is an incredible static analysis tool that helps monitor and improve the quality of .NET code through in-depth reporting, code metrics, and visualizations.
The diagram below shows the complexity of the library that we are currently investigating.
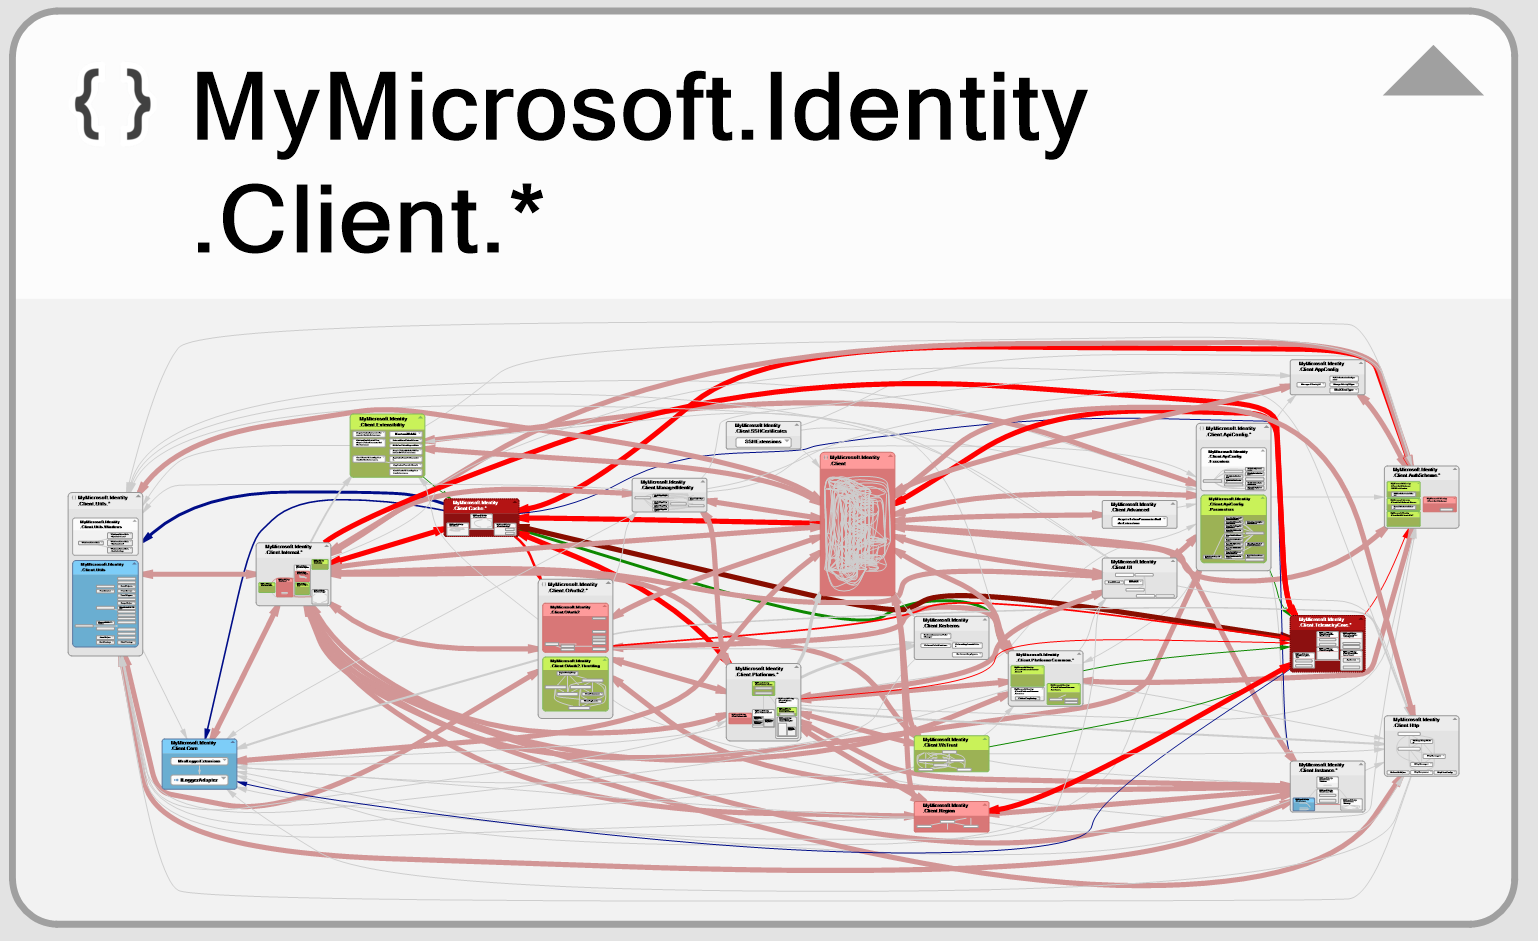
Using NDepend, I can quickly drill down into the structure of this code library and analyze its dependencies, structure, and more. This provides a static view of the codebase that makes understanding complex and unfamiliar systems much easier.
This is a good starting point, but what else can I do and how can code coverage help me to understand a codebase?
Introducing NCrunch - the Live Testing Tool for .NET
NCrunch is an automated continuous testing tool for .NET that integrates with Visual Studio and JetBrains Rider. It provides real-time code quality and performance feedback by running tests concurrently as you type. It tracks code coverage, collects performance metrics, and displays exceptions inline, making test-driven development fun!
But wait a minute, this is a code-coverage tool. How can this tool help me understand a codebase better?
Now typically, you run all your tests against your application and track the code coverage using NCrunch or similar tools.
From these runs, you can get the code coverage metrics per project, for example:
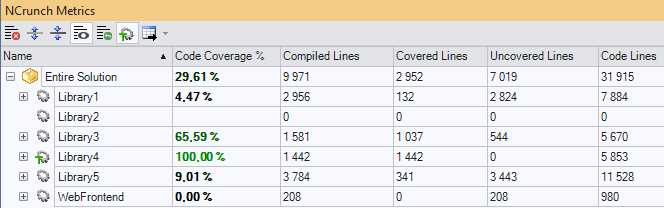
This is all good, but I don’t want the total code coverage when exploring and understanding a new codebase; I want something else!
Can I use NCrunch in some other way to help me discover a new codebase?
What if I only have one single test? What would that enable?
Using NCrunch with just one test
Code coverage with just one test might seem ridiculous, but let’s explore this scenario.
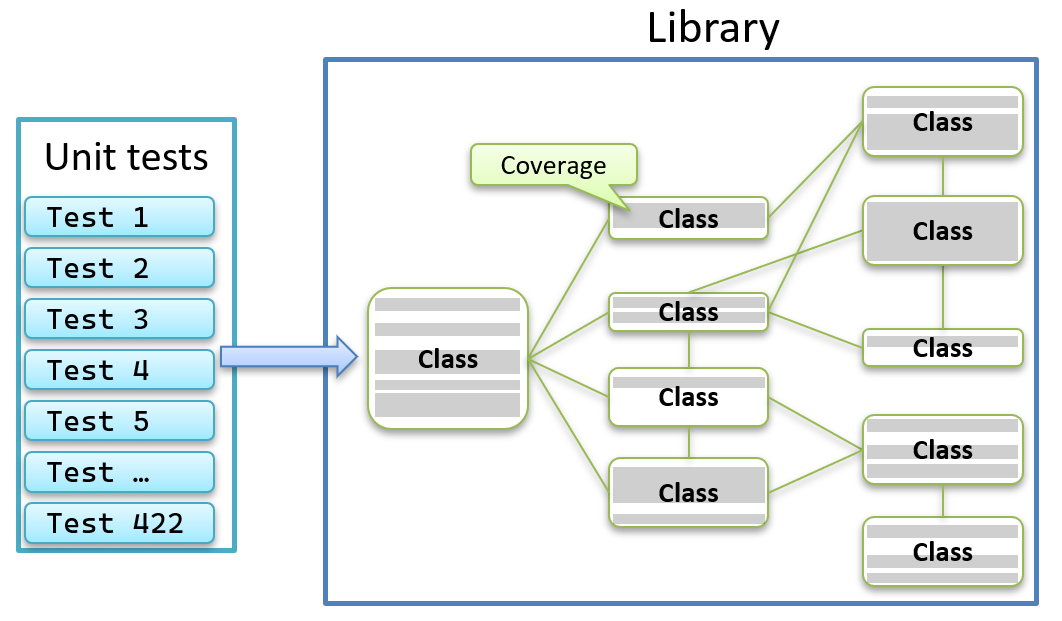
Having just one test would allow me to see the entire code path through the application for a specific operation like this:
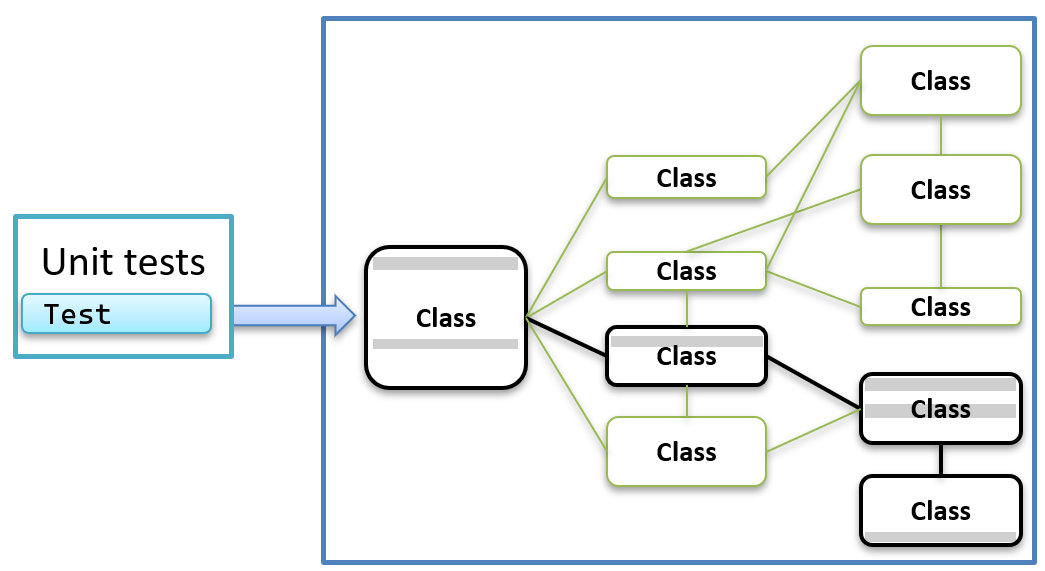
But wait a minute? A code coverage tool only returns me the coverage numbers. Like this?
How would this help me to understand a codebase?
The advantage of NCrunch is that it tracks my code coverage in real-time and visually shows the coverage in my editor, like this:
Simple code coverage example
Let’s look at a simple example. Let’s say we have this calculator:
					public class Calculator
{
    public int MagicAdd(int x, int y)
    {
        if (x > 0 && y > 0)
        {
            int result = x + y;
            PrintAnswer(result);
            return result;
        }
        else
        {
            return 0;
        }
    }

    private void PrintAnswer(int result)
    {
        if (result > 0)
            Console.WriteLine($"Positive: {result}");
        else
            Console.WriteLine($"Negative: {result}");
    }
Let’s add a single simple test:
					public class UnitTest1
{
    [Fact]
    public void Test1()
    {
        var sut = new Calculator();

        int result = sut.MagicAdd(10, 20);
    }
}
If we enable NCrunch on this project, we will see the following code coverage:
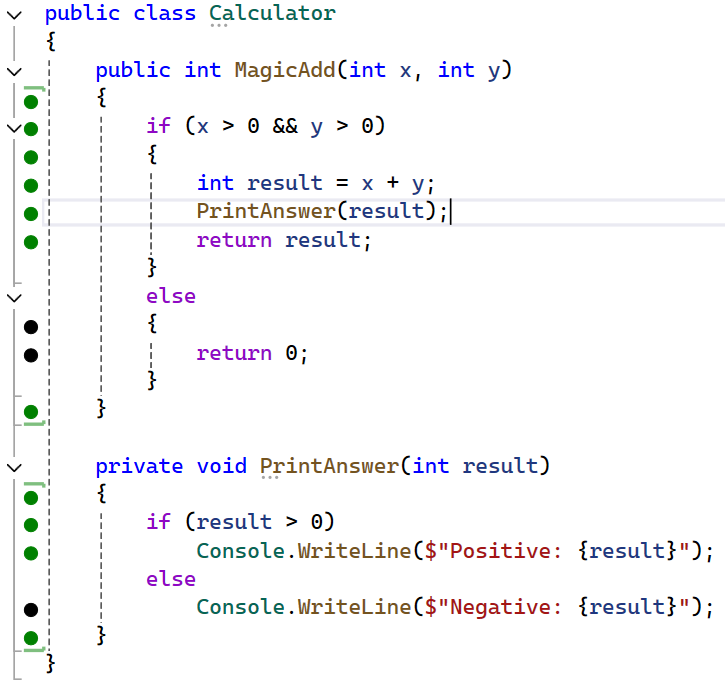
Using the green and black dots, I can see which part of the codebase was executed when I did this operation.
Ok, this is so cool! But can we do even better?
Runtime Data Inspection (RDI)
The Runtime Data Inspection (‘RDI’) is a real-time analysis system in NCrunch that brings runtime data values and detailed code control flow inline into the IDE. You can read more about this feature here.
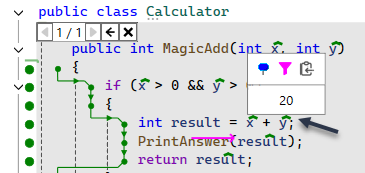
If we enable this feature in our simple example, we get this result:
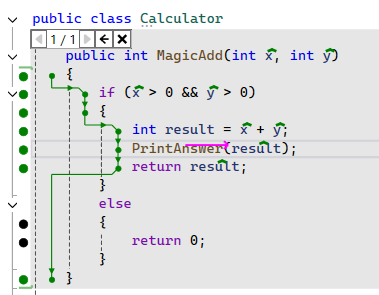
When enabled, I can get a visual representation of the code execution while editing my code.
Clicking on the green marker above a given variable allows me to view its value, as shown below:
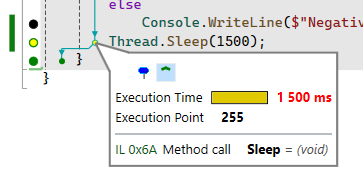
Hotspots are marked in the left column, and the execution of a given statement is displayed, allowing you to pinpoint bottlenecks in your application.
You can read more about the Runtime Data Inspection (RDI) features here.
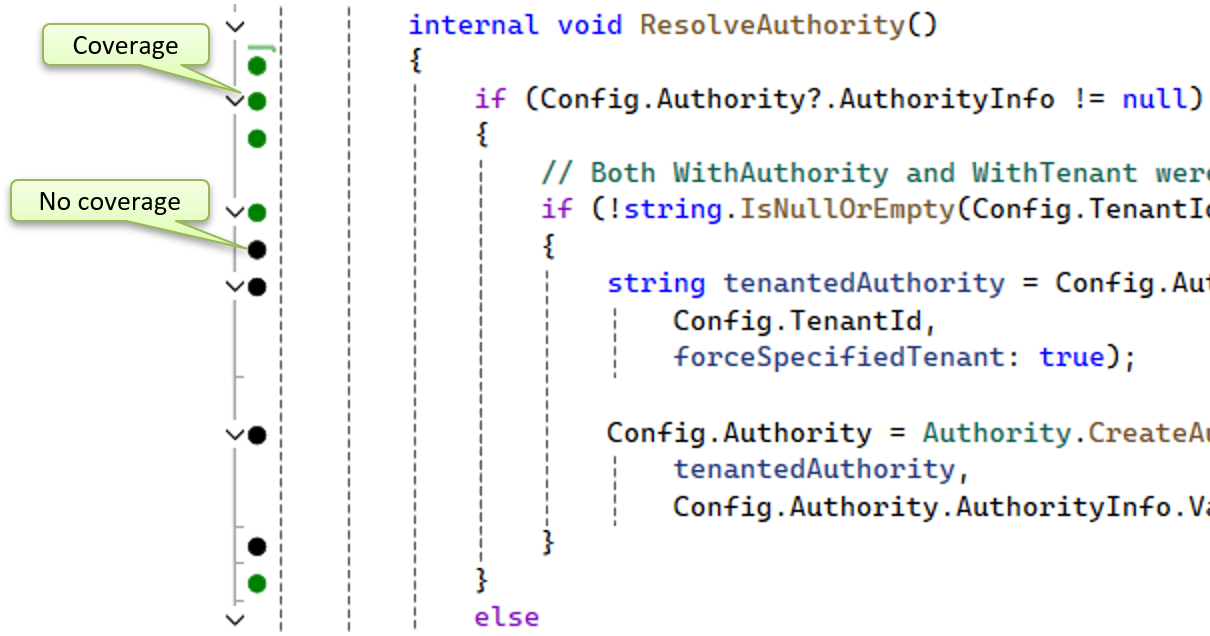
Back to MSAL.NET
So back to my example with MSAL.NET. Using this technique, I can write a unit test for one specific usage of this library like this:
					[Fact]
public async Task MyTest()
{
    string tenantID = "xxxxxxxxxxxxxxx";
    string clientID = "xxxxxxxxxxxxxxx";
    string secret = "xxxxxxxxxxxxxxx";
    string apiUrl = "https://graph.microsoft.com/";
    var authority = new Uri($"https://login.microsoftonline.com/{tenantID}");

    var app = ConfidentialClientApplicationBuilder.Create(clientID)
                                        .WithClientSecret(secret)
                                        .WithAuthority(authority)
                                        .Build();

    var scopes = new string[] { $"{apiUrl}.default" };

    var result = await app.AcquireTokenForClient(scopes).ExecuteAsync();

    var accessToken = result.AccessToken;
}
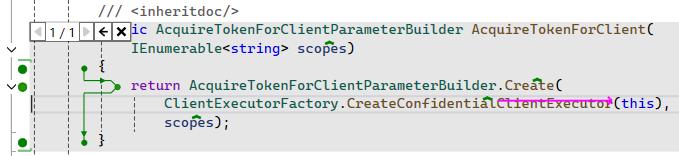
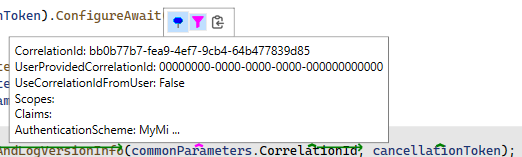
Then, I can enable the RDI overlay and easily navigate the codebase without running the debugger!
When visualizing the content of a given variable, NCrunch will call ToString on that given type.
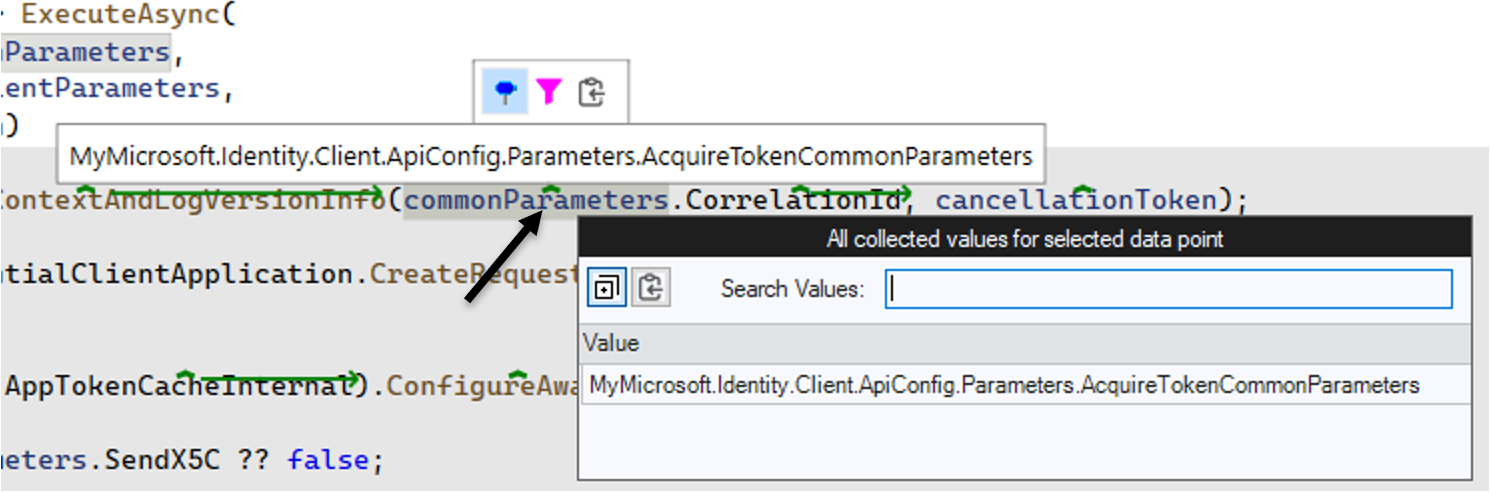
To see what is inside the variable, you can change the type to a record type or manually override ToString. When overriding ToString, it can look like this:
Further improvements can be made by tweaking the RDI data limits. You can read more about this here.
Conclusions
In all, using NCrunch for code coverage and real-time data inspection simplifies understanding new codebases. With this tool, developers can see code execution and inspect data as they write, making learning and understanding the codebase easier. This method is efficient and makes exploring complex codebases more accessible and engaging.
NDepend also works well with NCrunch; for example, you can import NCrunch code coverage data into NDepend for further analysis. Examples of what you can extract from this information can be found here: , here and here.
These are two tools that I highly recommend every developer should have in their toolbox.
Feedback, comments, found any bugs?
Let me know if you have any feedback, anything I missed or any bugs/typos. You can find my contact details here.
Resources:
About the author
Hey! I’m Tore 👋 I have been actively involved in the .NET and C# communities since they got started in the early 2000s. As a Microsoft MVP in .NET and independent consultant, trainer, and coach, I help companies and teams to simplify, speed-up, and enrich their ability to build exceptional and secure applications on .NET. Interested in working with me? You can find out more here.